User Guide

Cardiogram transforms your wearables into a portable heart-health monitor, and your smart phone into your heart’s personal interpreter. It does this through our algorithm, (which has been rigorously tested in multiple studies, and peer-reviewed for accuracy).
This guide is for users, old and new, who want to take a deeper dive into how to get the most out of their Cardiogram app. Here, you’ll find detailed steps for the different elements of your app, so you can become well-attuned to the language of your heart.
Getting Started
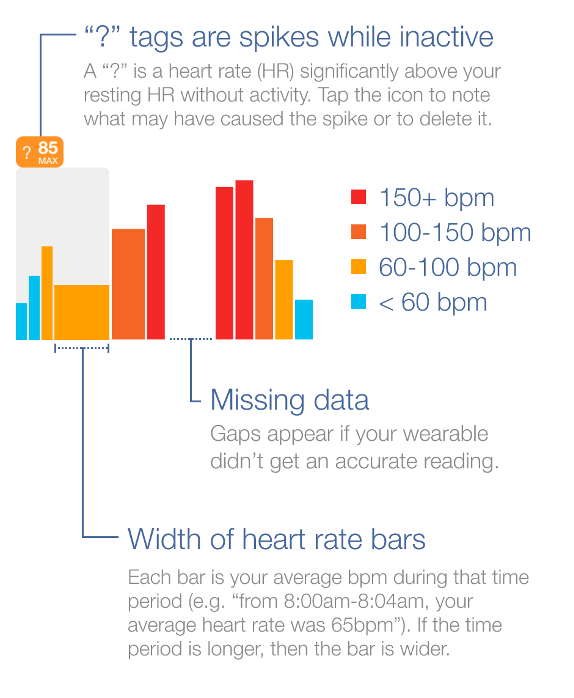
The colors in the bar chart are based on a “normal” resting heart rate for non-athletes. The range is between 60-100 bpm.
Helpful Hint: To pull up this “cheat sheet” while in Cardiogram, tap the three dots on the top right of your heart rate chart. Then tap “Legend”.
Now, here is a quick look at what each color represents in in more detail:
Red: 150+ bpm (Typically an indication of extreme stress or physical exertion)
Dark Orange: 100-150 bpm (Could mean mild to moderate stress or physical exertion)
Light Orange: 60-100 bpm (This is considered the “normal” resting heart rate zone)
Blue: Less than 60 bpm (You will be here most often while sleeping or at a full rest)
THE STEP BAR
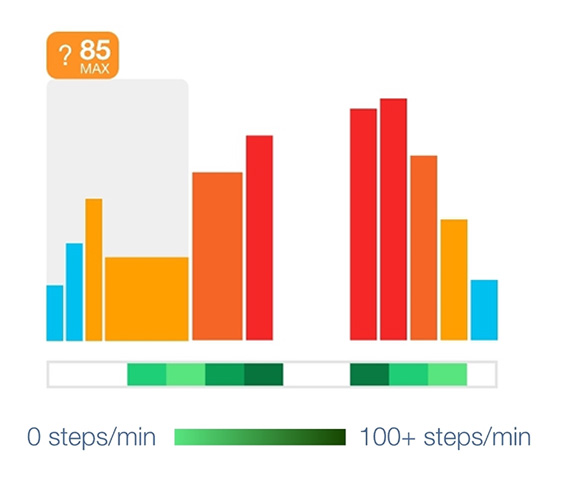
The line of green and white bars directly underneath the HR bars lets you gauge your steps per minute. Each rectangle represents a 10-minute period. The darker the green, the more steps you took during that 10-minute window. And white rectangles show windows of time where you were inactive.
You can use this step bar as another way of noticing times and patterns where you’ve had an elevated heart rate without much physical activity.
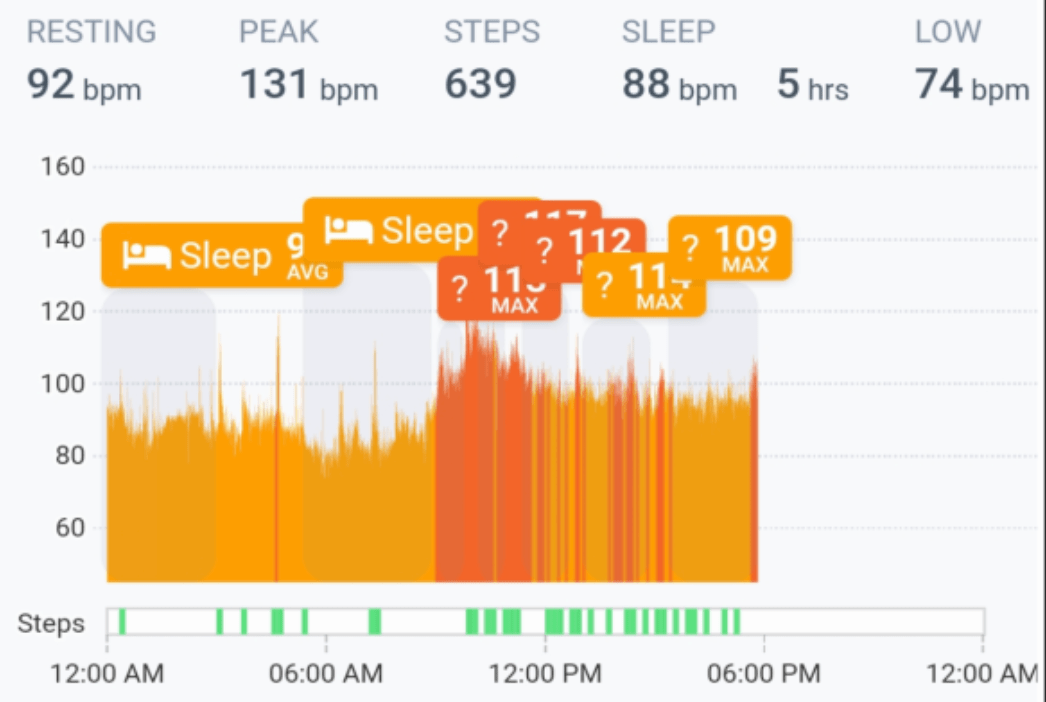
Using the tagging feature regularly can help you to understand how certain activities and environments affect your heart rate. It also helps you easily view all episodes of irregular heart rates. We recommend that you tag anything that could help you or your doctor track when you experience atypical HR changes.
- When you see a concerning heart rate in your Timeline pane, tap “Tag” to add what you were doing at that time.
- Go to the “Insights” page to view recent tags.
- The main tab displays all of your tags from the past 30 days. You can sort tags by how often you added them, peak HR, or average HR.
- Tap a tag to see all the instances it was added.
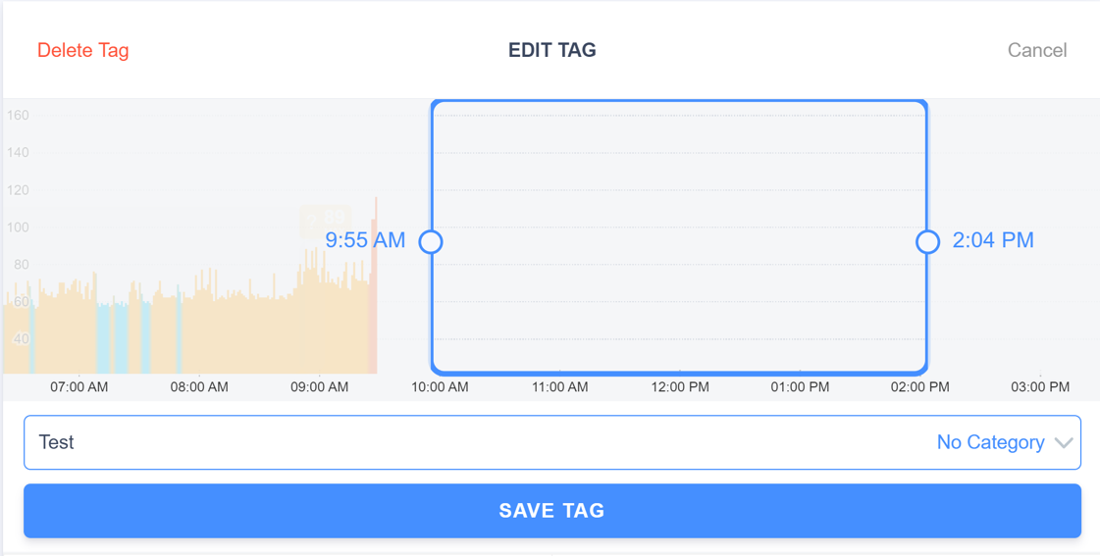
How do I update a tag?
Each time after you exercise, Cardiogram will generate a separate workout graph. Workouts are automatically created if the workout appears in the Health app (iOS), Google Fit (Android), or Fitbit app. You can also manually create a workout within Cardiogram using tags. For detailed information on either of these methods, read our article.
There are three screens associated with each workout: Your workout heart rate overview info, Heart Rate Zone summary and Heart Rate Recovery (HRR) info. To move between these screens, simply swipe left at the bottom of the workout where you see the three dots.
Helpful Hint: You can zoom in on your workout graph for a more in-depth look by using "pinch-to-zoom".
If you notice missing data, please note that this can happen during workouts since the watch can move and lose direct contact with skin (often due to sweat). To help prevent this, make sure the watch is in contact with your skin by tightening the band before a workout.
You can view your 1-minute and 2-minute heart rate recovery on your workouts in Cardiogram. Both HRR one minute and two minutes after your workouts will be shown on the timeline pane. To get accurate HRR readings, be sure to follow these steps:
- Turn on workout mode on your wearable. Please visit this article for more information.
- Towards the end of your workout, get your heart rate at least 70% of your max heart rate. Note: your max heart rate can be estimated by subtracting your age from 220. For example, if you're 55 years old, your estimated max heart rate is 165.
- End your workouts as soon as you stop exercising.
- Keep your wearable on and rest for 2 minutes after you end your workout. Avoid things that would elevate your heart rate, like walking or lifting things.
Some devices will increase the heart rate sensor frequency during a workout, but return back to a less frequent reading (e.g. every 5 minutes) after the workout has ended.
Currently, HRR only works reliably for Apple Watch and Fitbit devices. This is because these devices measure your heart rate at a high frequency (at least every 5 seconds) by default or for the period after you end your workout.
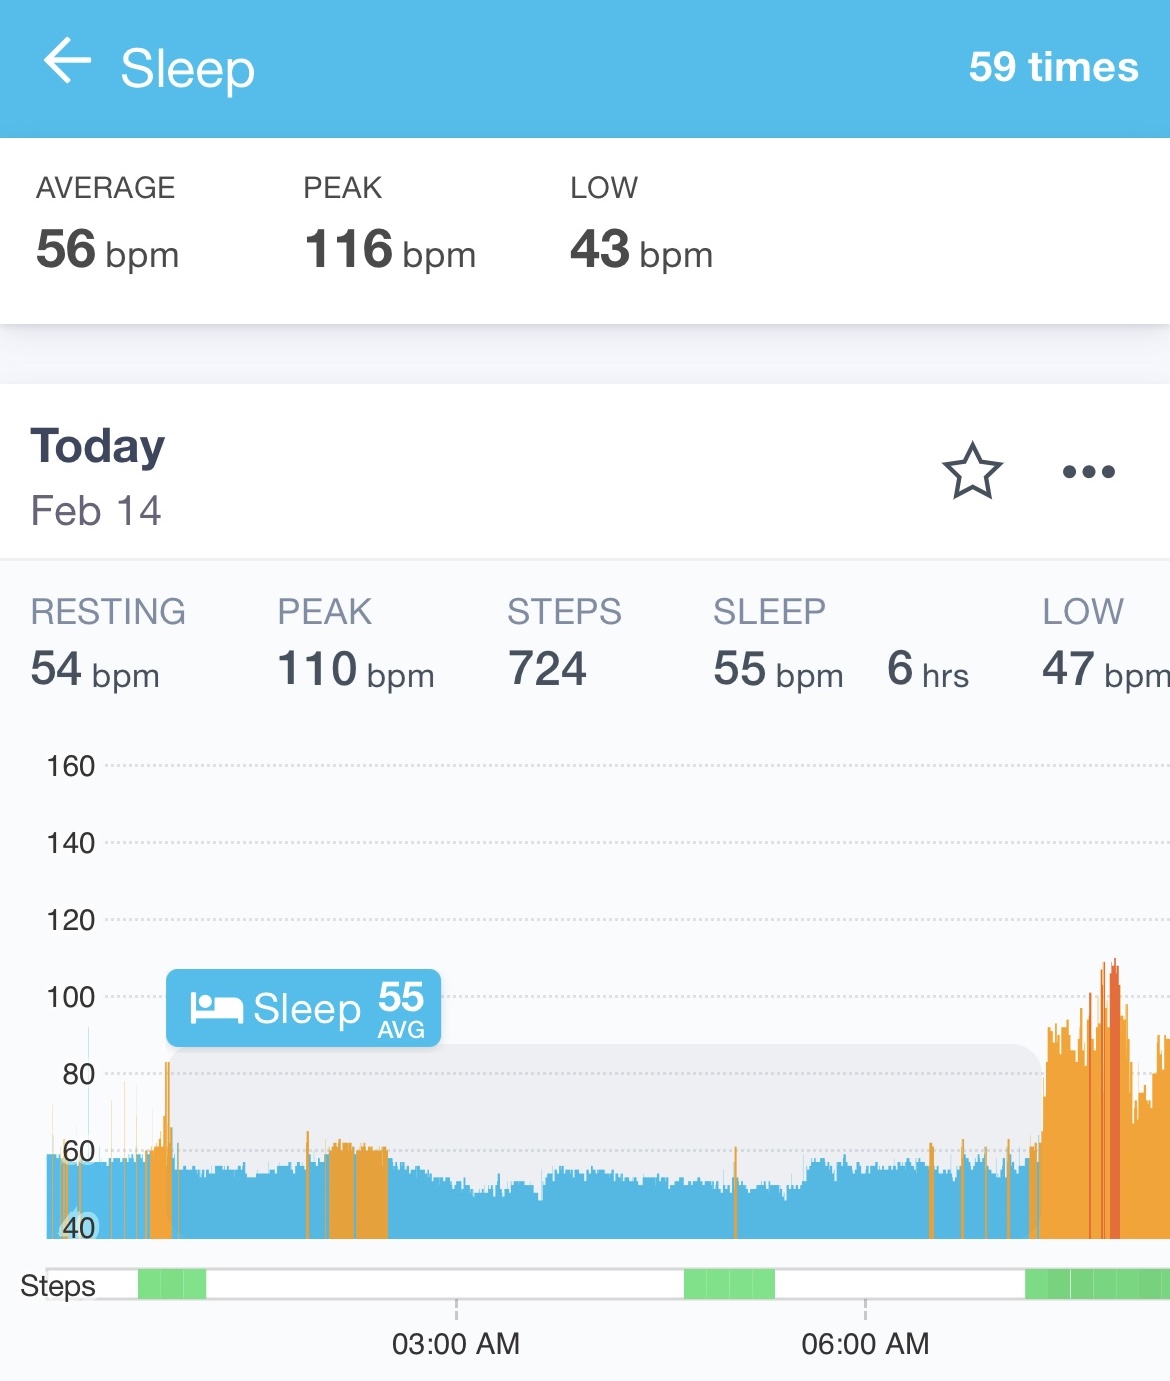
Your daily sleep stats are shown directly on your heart rate timeline. We include your average heart rate during sleep (Sleep BPM) and total sleep duration.
Cardiogram calculates these stats based on the "Sleep" tags on your Cardiogram graph. Sometimes these tags are created automatically (e.g. if the Fitbit or Garmin app tells us you're sleeping, or if you use a third-party sleep app that adds sleep data to your Health app or Google Fit). See this doc for help setting up automatic sleep tracking.
Once a “Sleep” tag is created, you can view it under your Tag Insights and view your average, peak, and low heart rates during that resting period.
If you don't to see sleep stats:
- Create a tag on your daily graph using the blue "Tag" button.
- Highlight the time that you were sleeping
- Name the tag "Sleep".
- When you refresh your Timeline, you should see a sleep BPM and sleep duration for the "Sleep" tag.
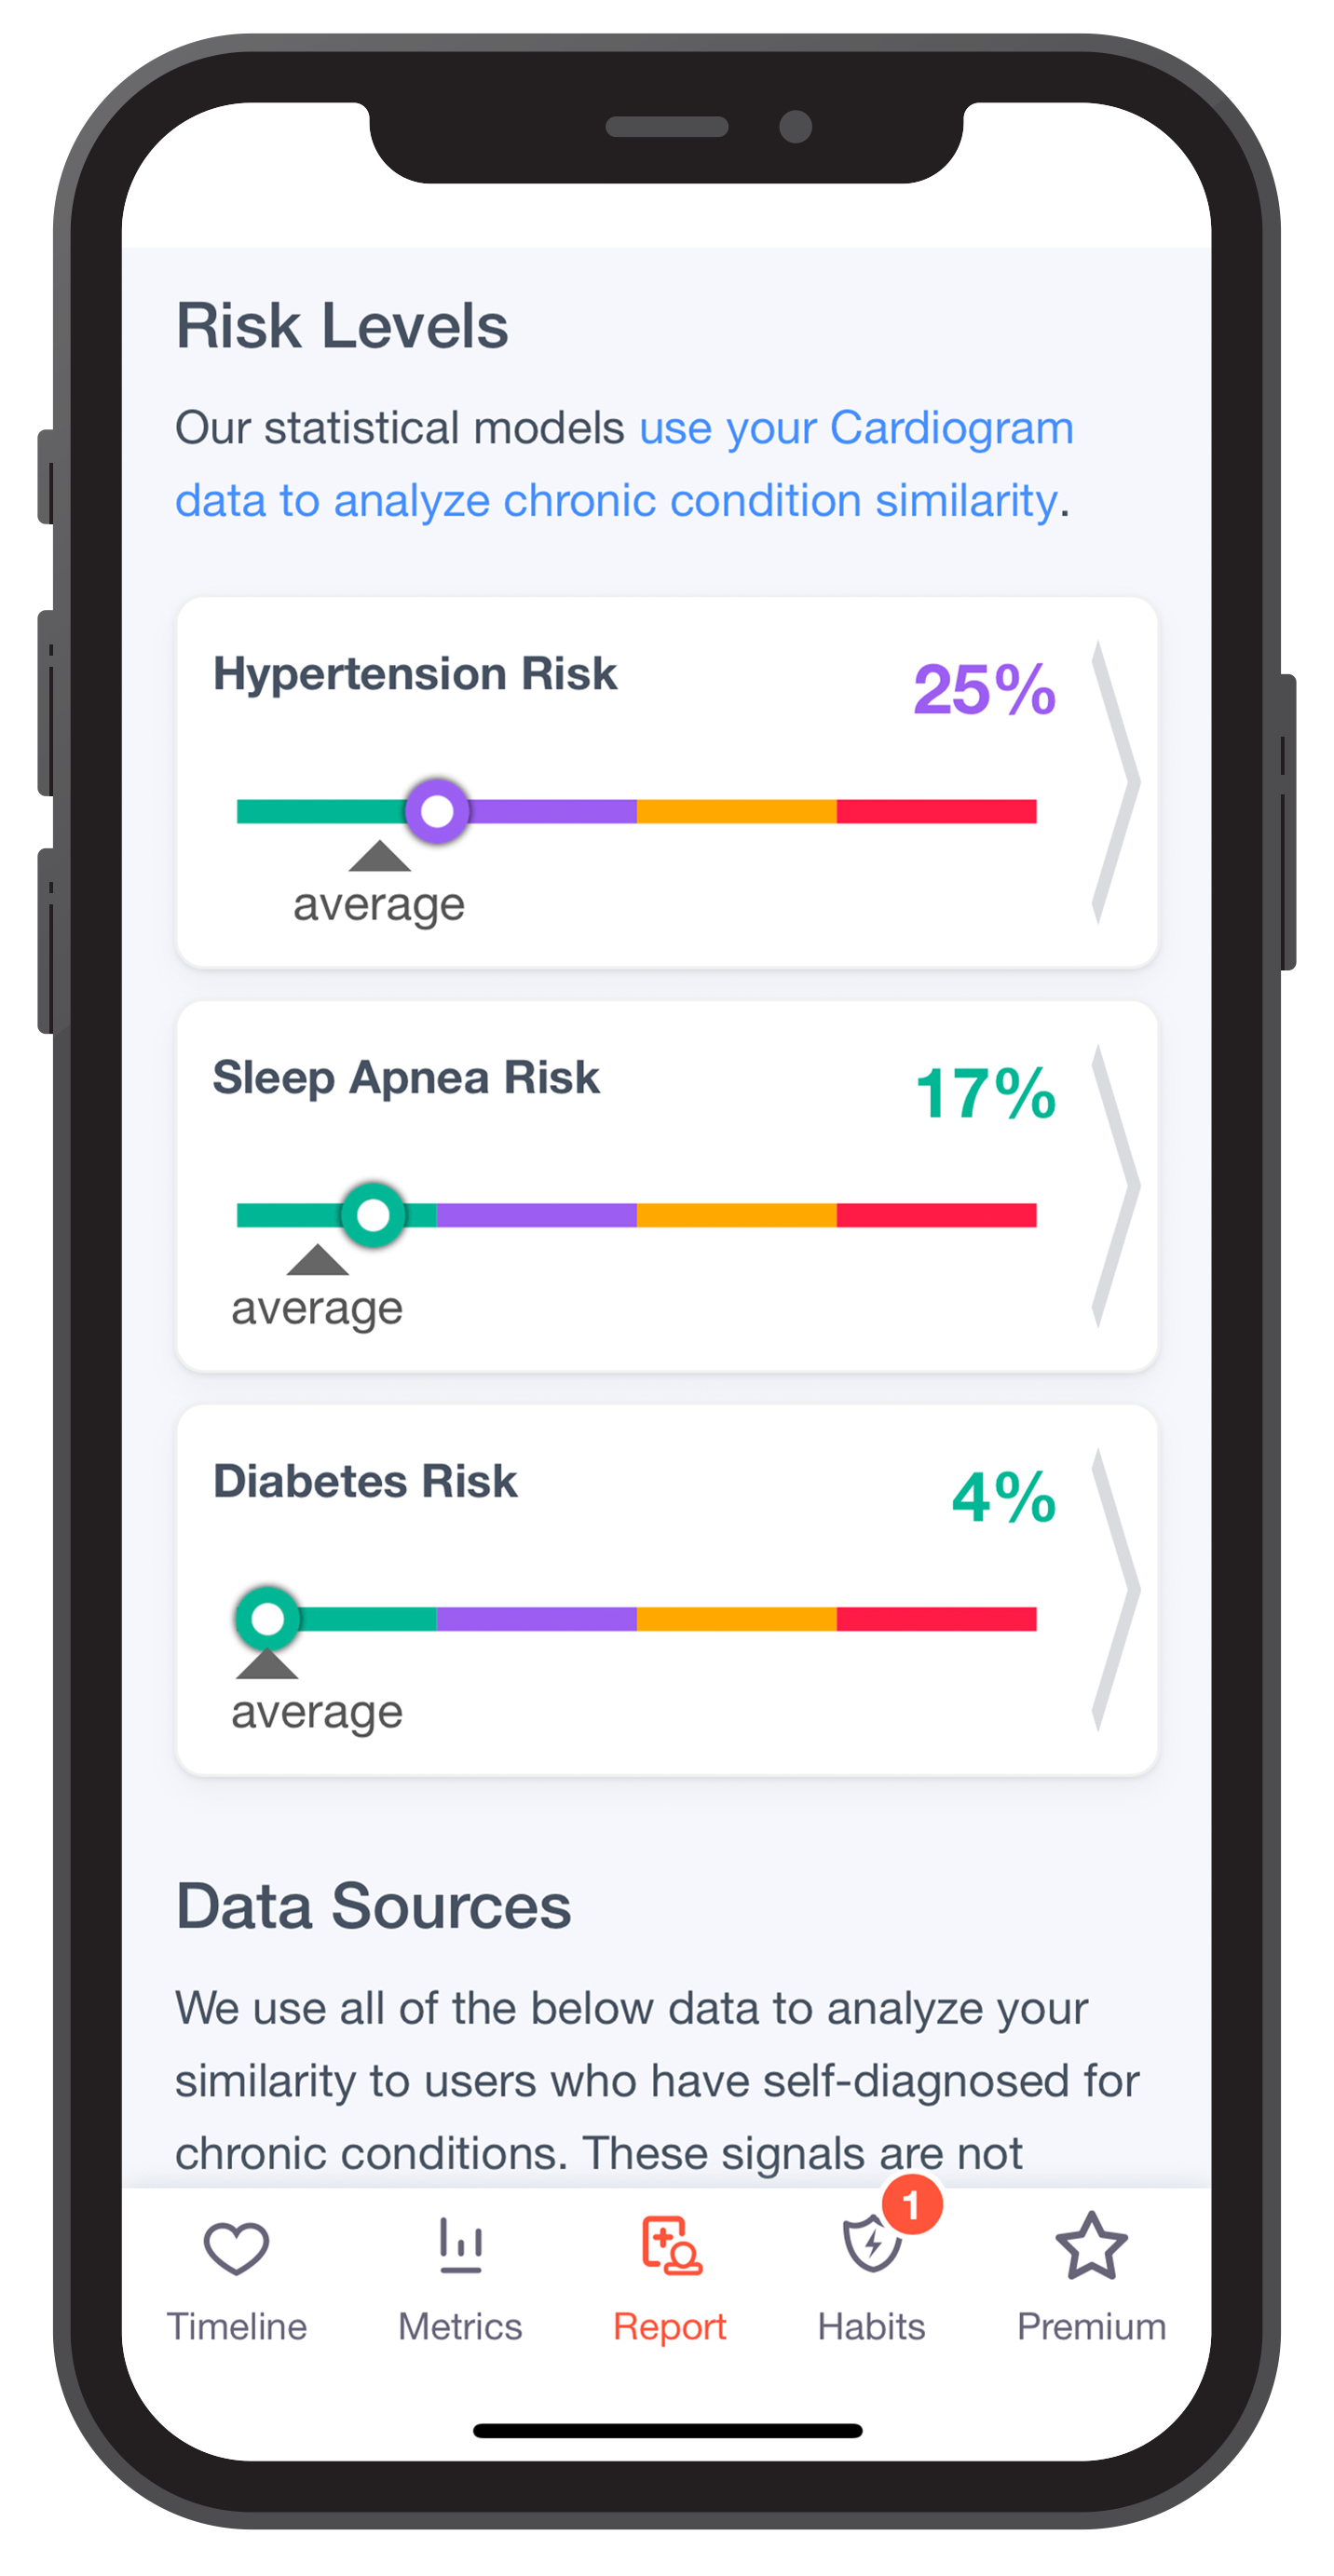
Through weekly Report Cards, you can discover your personal health score and risk level for hypertension, sleep apnea and diabetes, and how they compare to others your age. We’ll also share personalized and actionable suggestions for improvements.
Our Report Card feature employs artificial intelligence (AI) to estimate risk levels for specific conditions. We developed our AI, DeepHeart, based on our published academic papers and our partnership with UC San Francisco.
To access your Report Card, simply tap the “Report” icon at the bottom of your screen.
*** Disclaimer: Report Card does not provide clinical diagnoses and should not be considered a replacement for your doctor. Please reach out to your physician if you are at all concerned about your health.
We don't want users to be misled by small daily fluctuations in their risk score, so we re-run our calculations for each user once a week, as well as whenever you update your physical profile (age, sex at birth, weight, height).
Since a large volume of data needs to be processed for each user to receive their customized score, it can take up to 72 hours to get a result. If you still do not have your score after 72 hours, please contact us at [email protected] with the subject "Score Delay." Please include the email associated with your Cardiogram account, as well as a screenshot of your profile page.
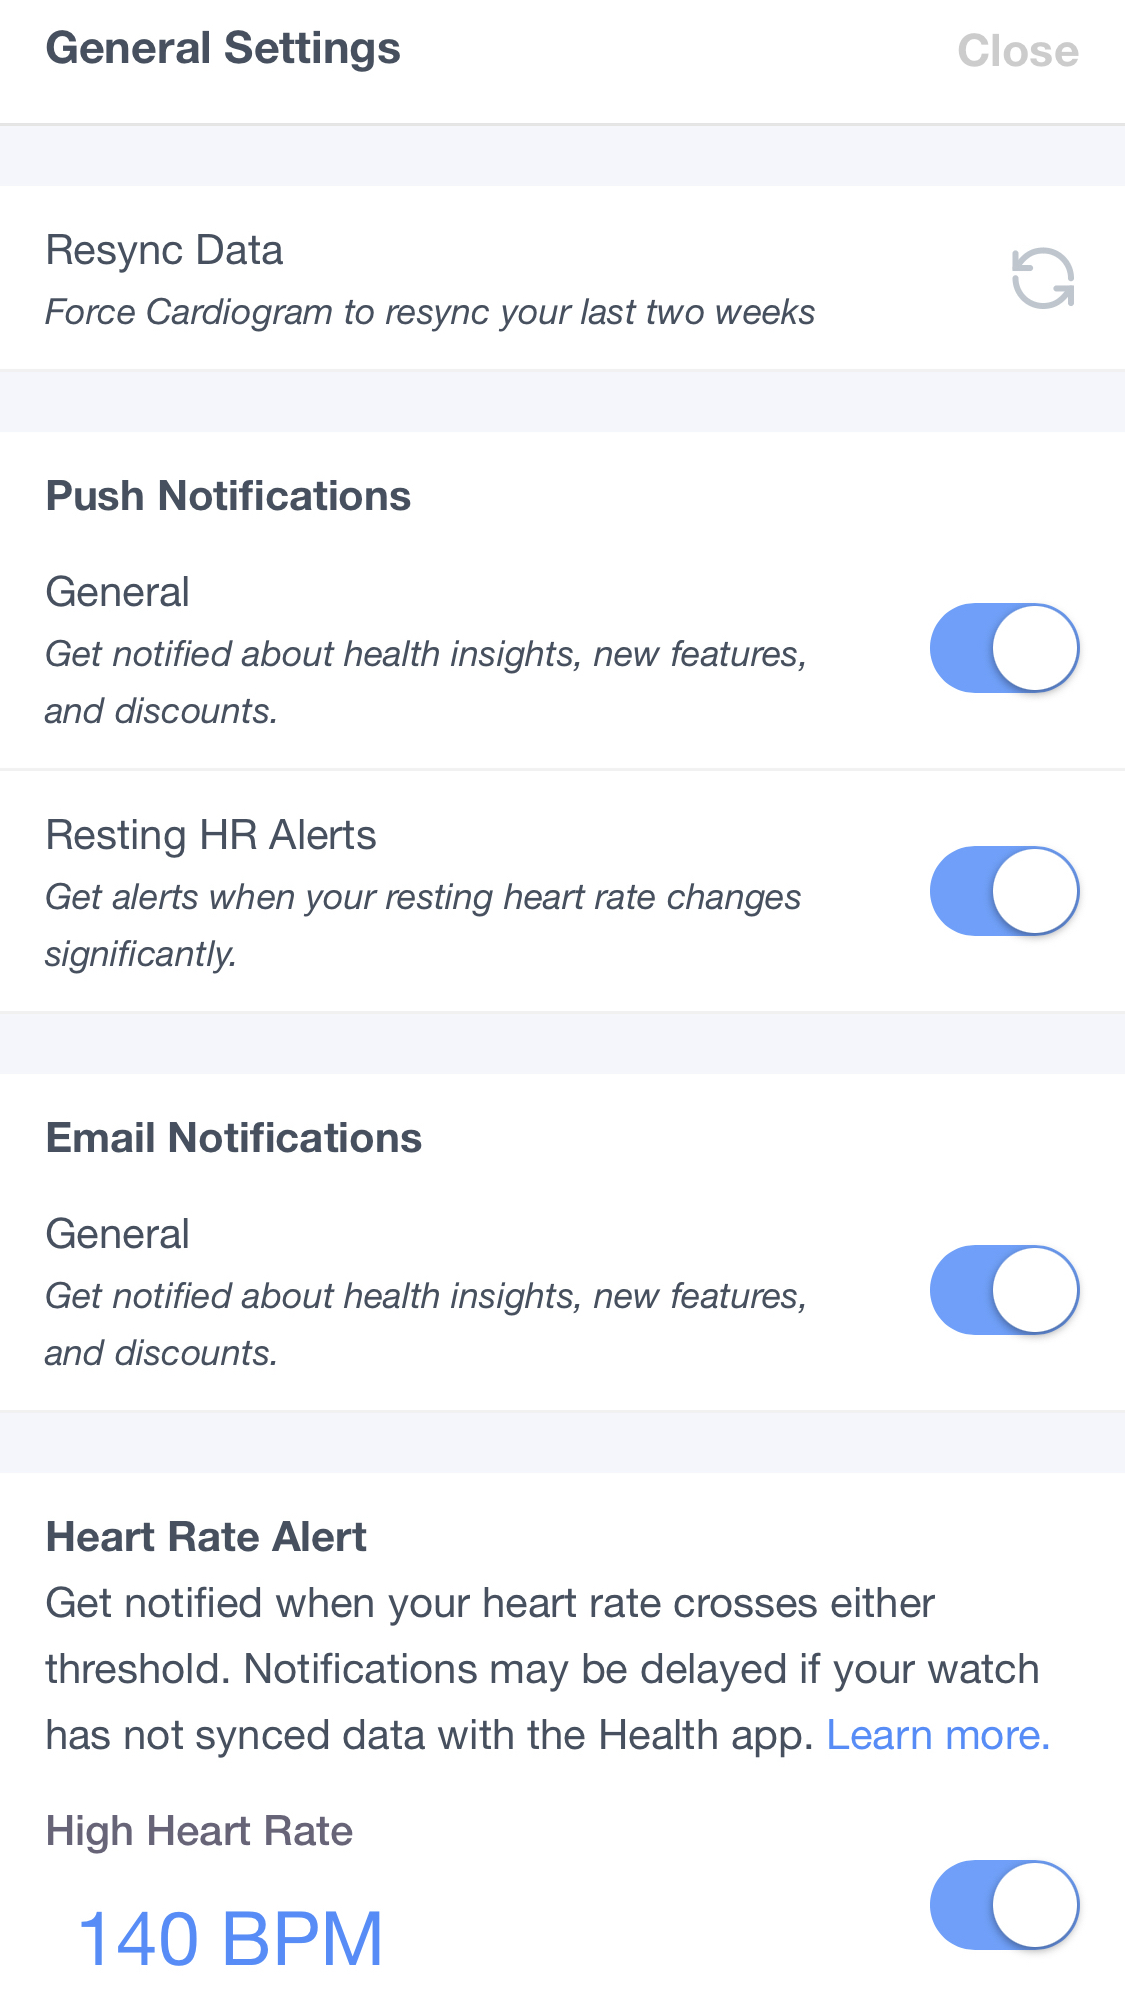
Our HR Alerts feature allows Cardiogram to notify you if your heart rate goes above or below your preferred heart rate zone. Because all hearts are different, and concerns vary, you can customize your threshold to your personal range.
Setting up or editing your Heart Rate Alerts is simple. Activate and adjust them directly from the General Settings page in your Cardiogram app:
Note: Notifications may be delayed if your wearable hasn’t synced data to Cardiogram.
If you find that your alerts still aren’t working, verify push notifications are turned on for Cardiogram in your phone settings:
- Open the "Settings" app on your phone
- Scroll down to find "Cardiogram" in the app list.
- Within "Cardiogram", tap "Notifications".
- Make sure 'Allow Notifications' (Apple) / 'Show Notifications' (Android) is turned on.
Once you enable push notifications for Cardiogram, you should start receiving heart rate alerts. If your HR notifications are delated, find more info here. However, if you re-install Cardiogram or change to a new phone, you will need to re-enable push notifications.
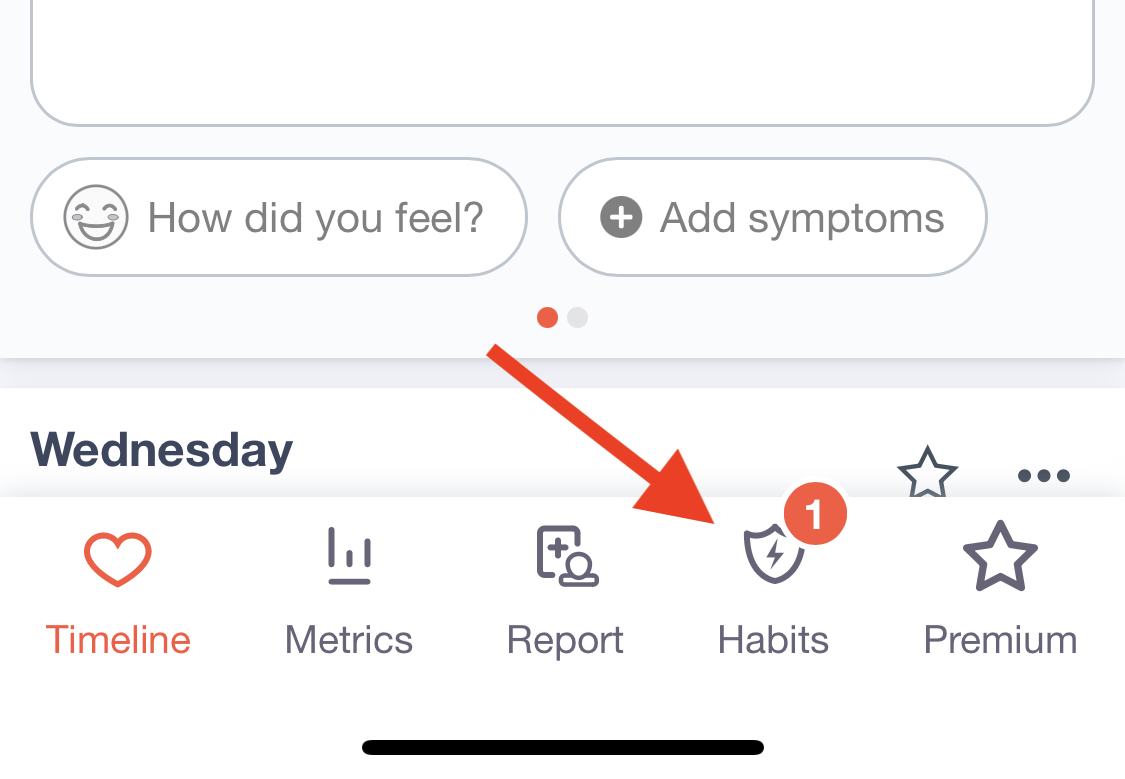
Your “Habits” section allows you to choose from our three habit sections: Health & Fitness, Stress Relief, and Sleep Quality. By tapping “All Habits” you can view all available habits. Once you find one you’d like to commit to, tap on the habit and then select “Start Habit”.
Once enrolled, you can view your habits under “My Habits” and mark the days you accomplish that task on that habit’s calendar. You can enroll in as many habits as you see fit. You also have the option to Invite Friends to join you for added accountability.
Anytime you’re ready to end a habit, simply go to “My Habits” and select the habit you’re ending. On your calendar screen, scroll to the bottom and click “Abandon Habit”.
Some wearables such as the Apple Watch (from Series 5 and onward) allow you to record an electrocardiogram (ECG or EKG) and capture blood pressure readings from connected devices. Cardiogram itself does not take ECGs or blood pressure readings but is able to import them from Apple Health and display them in your doctor report.
At this time, ECGs and blood pressure readings from other wearables cannot be imported into Cardiogram. If you are experiencing difficulties with taking ECGs using your wearable, please reach out to your manufacturer's support team (e.g., Apple Support). We plan to support ECGs once those manufacturers make that data available to apps such as Cardiogram.
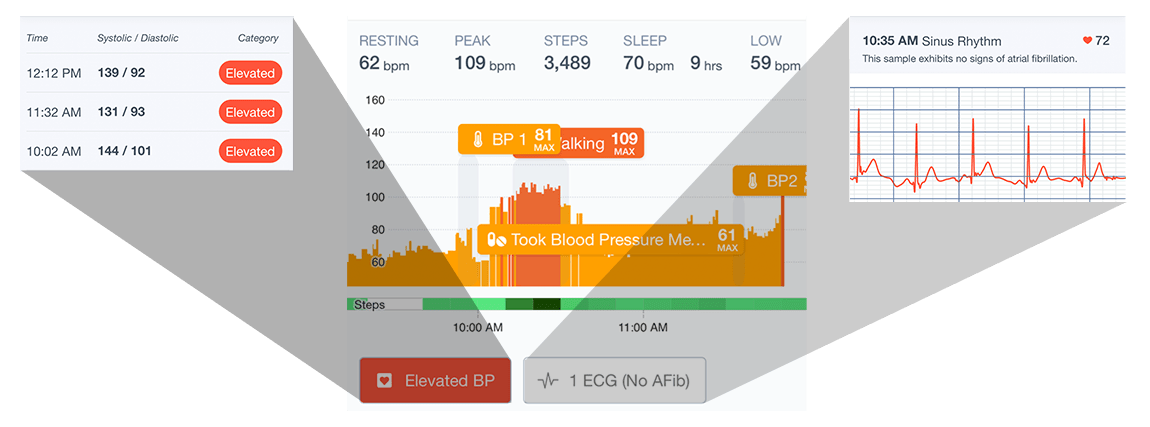
Smart Metrics, found in your “Metrics” section, allows you to view how your current trends are impacting your health and to receive suggestions for improvements. Smart Metrics’ insights are in real-time and are constantly updating. Rather than interpreting all your heart rate data yourself, Smart Metrics does it for you in an easy-to-understand and meaningful way.
To find your Smart Metrics, simply go to your Metrics Pane. You’ll find your Smart Metrics at the very top of the screen.
To fully take advantage of this feature, be sure to check in continuously as your insights will change throughout the day based on changes Cardiogram detects in your data. Of course, most importantly, you have to then follow through on the given cardio-conscious suggestions in order to see improved health outcomes.
Note: Always speak to your doctor before implementing lifestyle changes.
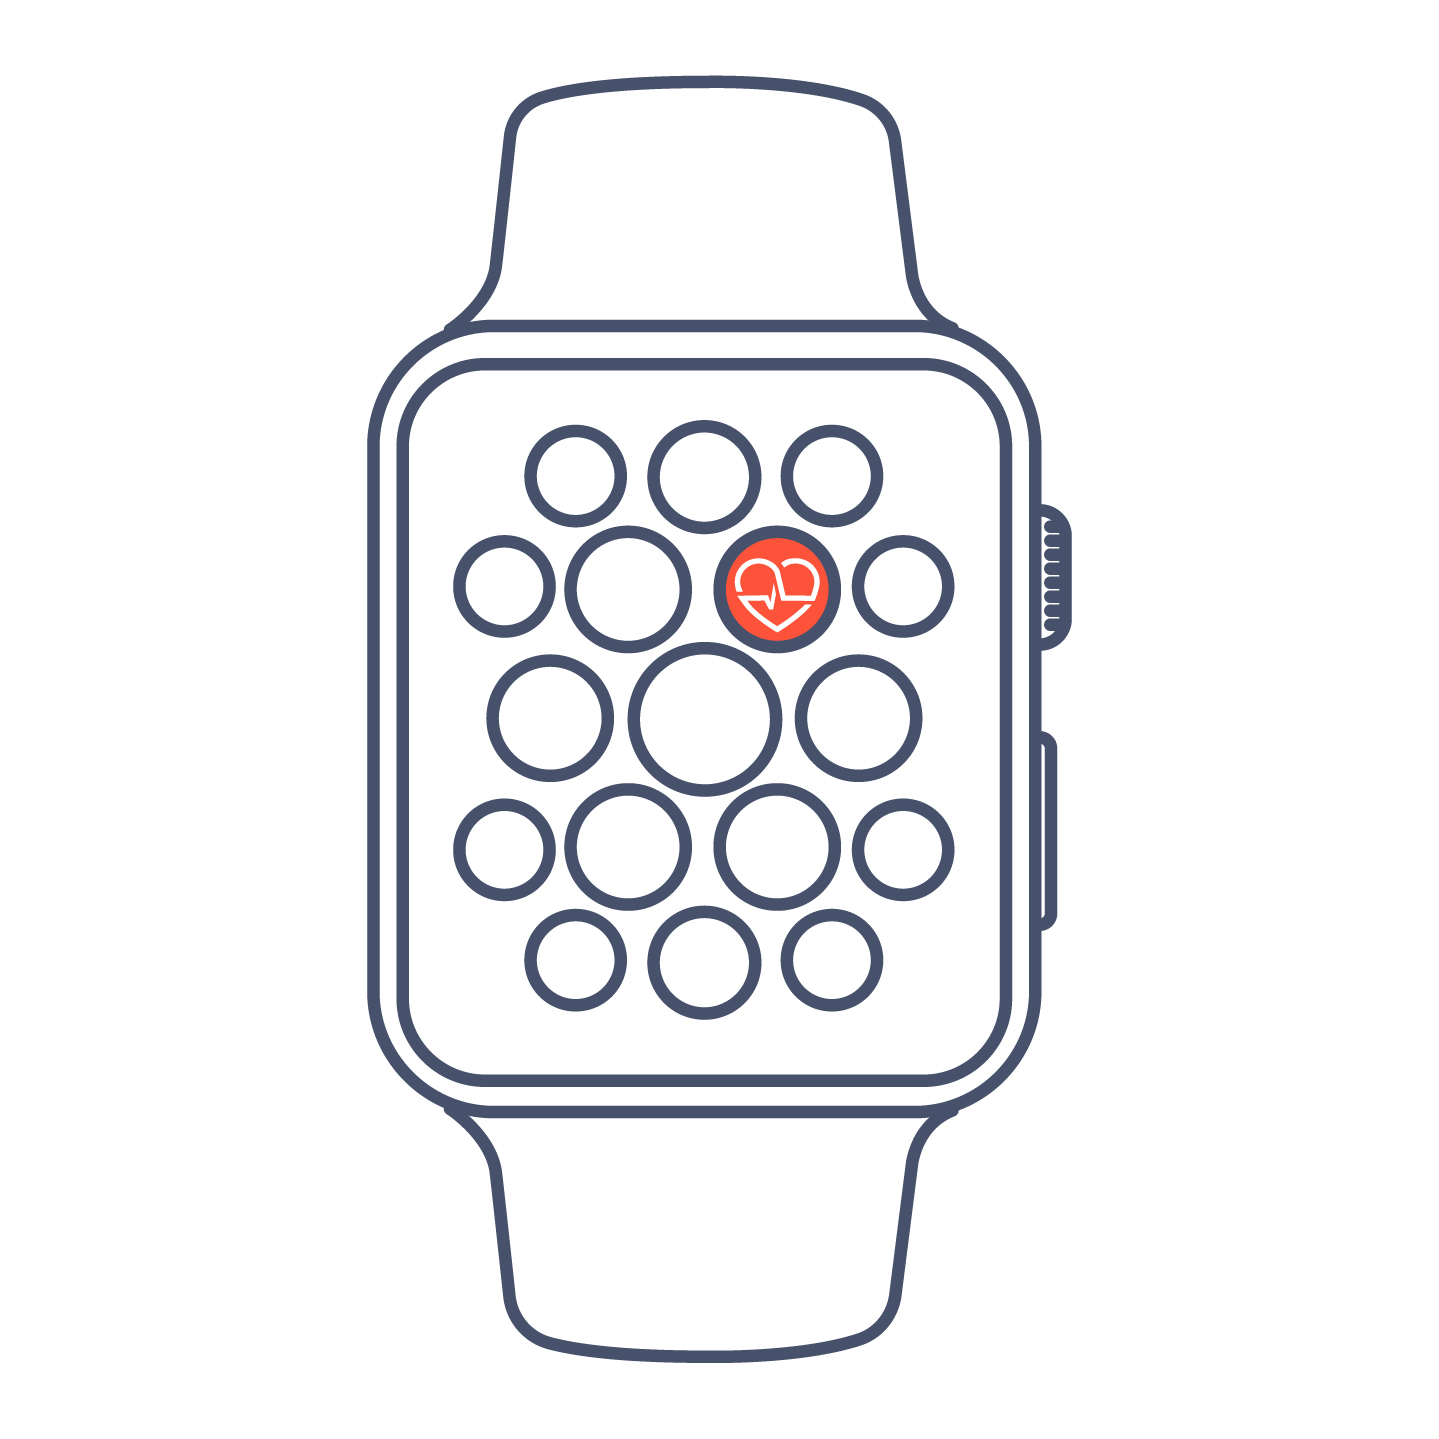
In order to instantly check your heart rate data from your Cardiogram app, add the Cardiogram companion app to your Apple Watch. The Apple watch face can be customized by selecting different complications, or special features. Not all watch faces allow you to add complications. However, if your watch does allow this, you can find Apple’s instructions on adding a new complication here, or follow these steps:
- With the watch face showing, touch and hold the display, then tap Edit.
- Swipe left all the way to the end.
- If a face offers complications, they’re shown on the last screen.
- Tap a complication to select it, then turn the Digital Crown to choose a new one—Activity or Heart Rate, for example.
- When you’re finished, press the Digital Crown to save your changes, then tap the face to switch to it.
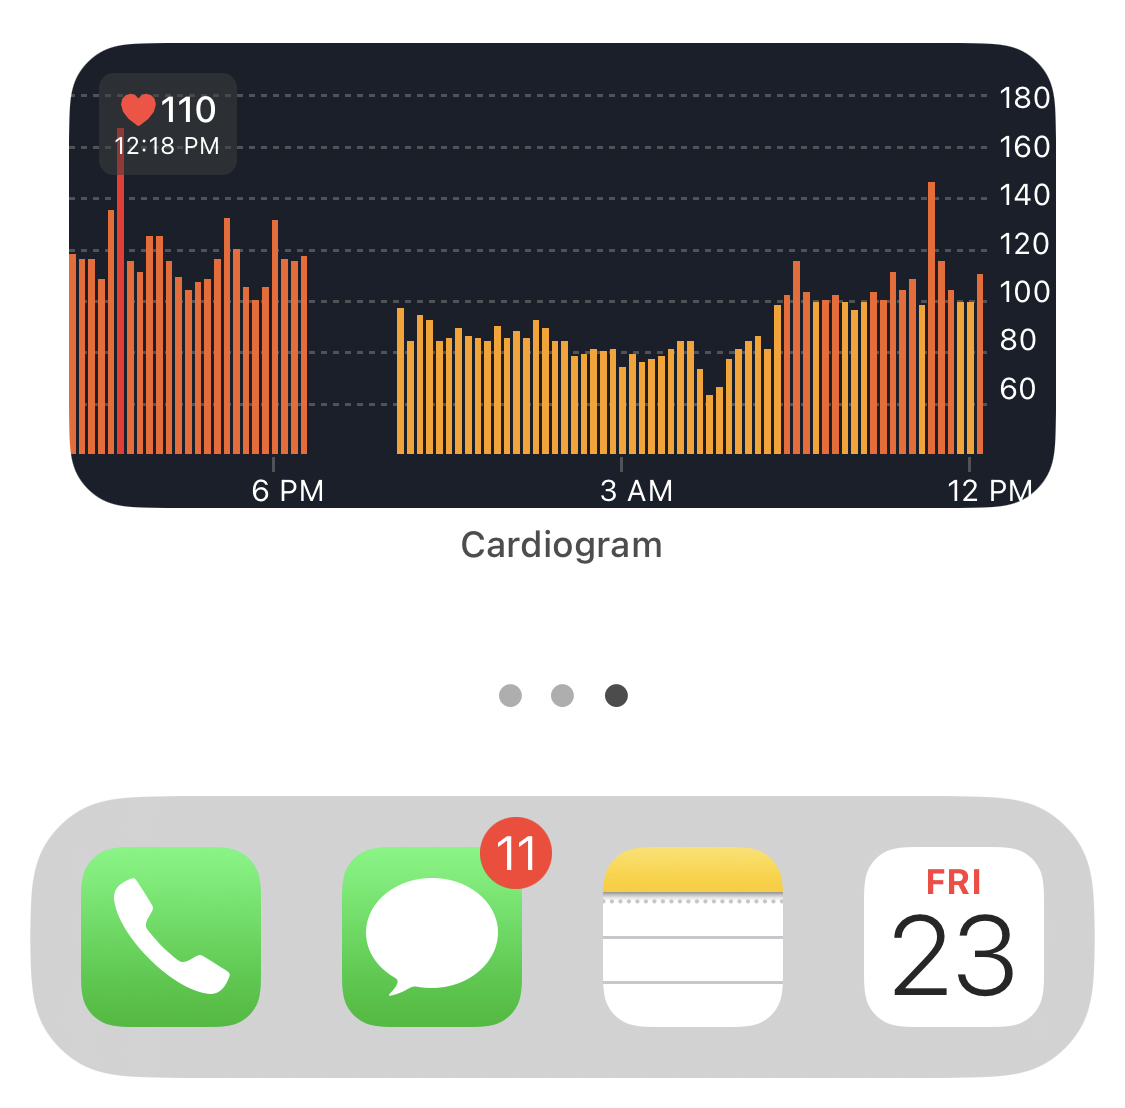
For those with an iPhone, you can also add our Cardiogram widget. (We’re currently working on this for Android users as well). You can add the Cardiogram Widget directly onto your iPhone’s home screen. Your heart rate graph will update periodically so you can quickly observe your heart rate patterns throughout the day.
You can choose between half-width and full-width layout options, and widget colors will automatically adjust based on whether your phone is set to dark or light mode. And if you press and hold the widget, you can adjust how many hours of heart rate data is displayed.
To add the iPhone Widget to your home screen, follow these simple steps:
- From your iPhone home screen, tap and hold anywhere in the background area
- Once the apps start to wiggle, tap the + icon in the upper left
- Search “Cardiogram”
- Select your preferred widget size
- Drag your widget wherever you’d like on your app grid
