
Normal Heart Rhythm is Irregular
Sometimes people say “irregular pulse” as a shorthand for an abnormal heart rhythm. That’s not quite right, because a normal pulse is irregular. In fact, it’s regularly irregular: your heart rate varies periodically due to your breathing rate and autonomic nervous system. The frequency and depth of variation reflects nearly everything that happens in your life, including your level of physical activity, emotional state, and whether you’re sleeping or waking.
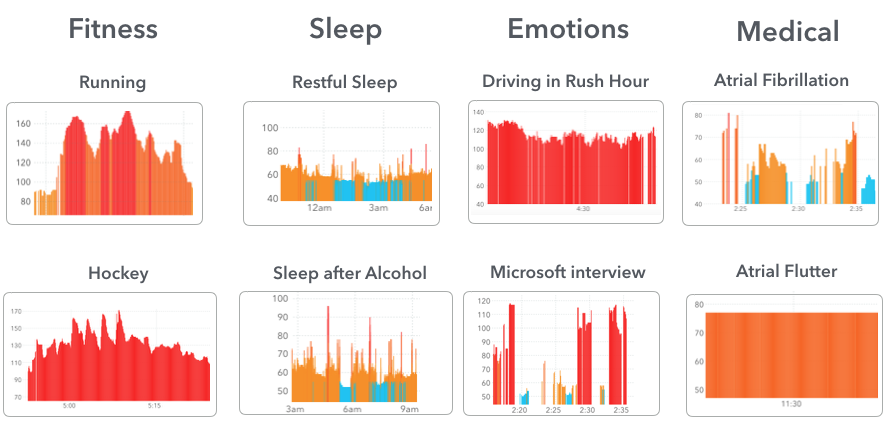
For example, here are six examples of normal heart rhythm (columns 1–3) and two abnormal rhythms (column 4) from Cardiogram for Apple Watch:
Even in normal rhythm, heart rate is highly variable. For example, in restful sleep, there’s a heart rate spike every 90 minutes or so (those are your REM cycles); between those spikes, there are smaller periodic fluctuations. While stressed during rush hour traffic, your heart rate can rise past 120 bpm— about as high as playing hockey—with a fast, wave-like variation. And atrial fibrillation and atrial flutter show that abnormal heart rhythms can range from chaotic to almost mechanically regular.
Key Background: ECG vs PPG
Before explaining the details of the abnormal rhythms, it helps to have a little background on the two most common types of heart rate sensors.
The gold standard in a hospital setting is an electrocardiogram, or ECG, which shows the voltage within your heart’s electrical system. In every normal heart beat, the top two chambers of the heart (the atria) contract first, producing a small voltage notch called the P wave. Specialized electrical tissue called the AV node causes a 120–200ms delay, and then the bottom two chambers of the heart (the ventricles) contract, producing a larger voltage spike called the QRS complex. In normal heart rhythm, every QRS complex follows a P wave [1].
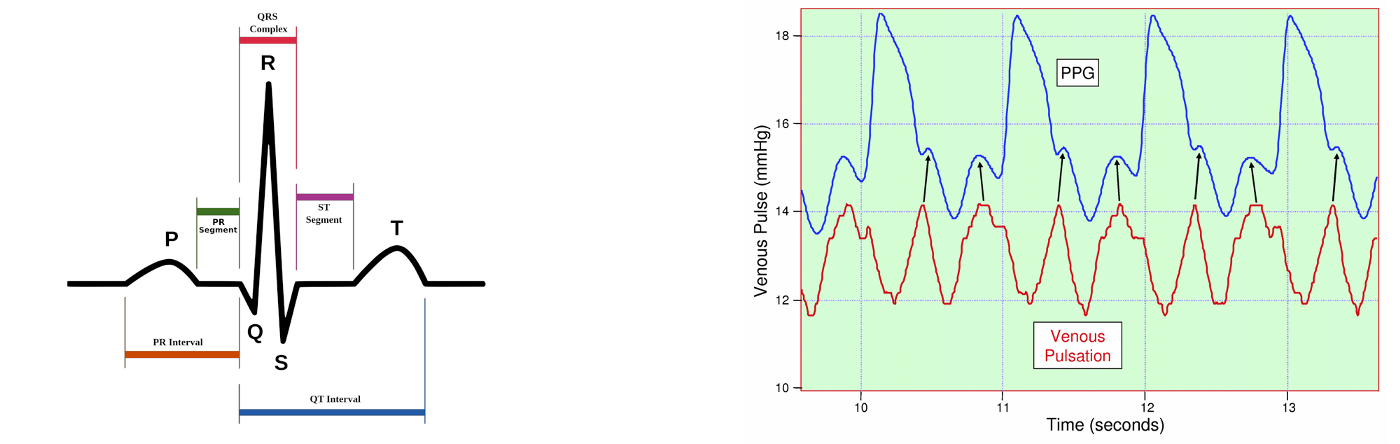
A cardiologist can infer quite a lot from even a short ECG reading. For example, if the QRS complex precedes or obscures the P wave, it indicates electrical impulses in the heart are traveling in reverse (from ventricles to AV node to atria), which can happen in a common arrhythmia called supraventricular tachycardia [2].
Consumer heart rate sensors, such as the Apple Watch, use an optical sensor based on photoplethysmography (PPG). Every time your heart beats, it sends a pulse wave throughout your arteries. Apple Watch measures those pulse waves at the wrist, but anywhere on the skin with good blood perfusion—e.g., your forehead, arm, chest, ear lobes—can be used to measure heart rate.
The drawback of PPG is that it only measures a pulse wave. You can’t see P waves or the intervals (PR, QS, QT) which give detailed clues about electrical conduction within different types of cardiac tissue. What’s more, most wearables analyze the raw PPG time series and then report an averaged heart rate (e.g., 76 beats per minute) to app developers. For Apple Watch on WatchOS 2.2, the highest resolution currently available is an average heart rate every five seconds. Nevertheless, with a longer sample time—say, ten minutes of data rather than 30 seconds—PPG data is sometimes clear enough to distinguish the rhythm visually. For more ambiguous cases, techniques like deep learning can help us separate the signal from the noise (more on that in future posts).
Atrial Fibrillation: An Irregularly Irregular Arrhythmia
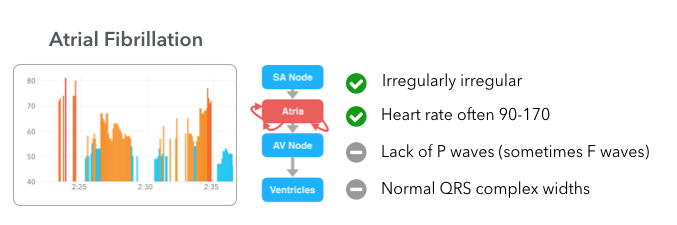
Atrial fibrillation is the most common abnormal heart rhythm, responsible for about a quarter of all strokes. In atrial fibrillation, electrical activity within the atria becomes chaotic, which causes the ventricles to contract at seemingly-random intervals. What’s worse, if you’re in atrial fibrillation, you may not feel it, potentially leading to cryptogenic stroke.
The good news is an optical heart rate sensor can detect atrial fibrillation. In the graph above, you can see high absolute variability (a range of 30+ bpm), a higher fraction missing measurements (anywhere without a colored vertical bar), and a lack of periodicity in heart rate variability.
Note that although atrial fibrillation is often paired with a higher heart rate (90–170), that’s not always the case. In the example above, the person’s heart rate is actually lower than average (often below 50bpm). And note that since we’re working with an optical heart rate sensor, we don’t get information on P waves or the width of the QRS complex. If we suspected asymptomatic atrial fibrillation based on Apple Watch data, we’d usually want to confirm with an ECG.
Atrial Flutter: A Regular Arrhythmia
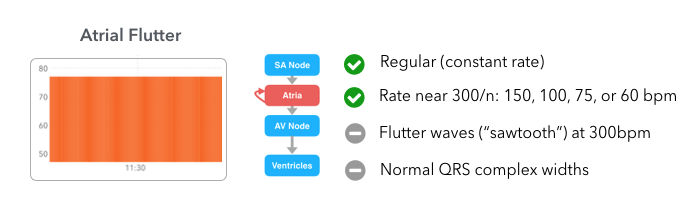
Abnormal heart rhythms can also be exceptionally regular. In atrial flutter, an electrical loop within the atria causes them to contract at around 300 beats per minute. The AV node acts as a rate limiter, transmitting every 2nd, 3rd, 4th, or 5th electrical impulse—2:1, 3:1, 4:1, or 5:1 conduction—so that the heart rate is near 150, 100, 75, or 60 bpm:
In the graph above, the person’s heart rate is at exactly 78bpm (implying an atrial rate of 312 and 4:1 conduction), with no variation at all. Like atrial fibrillation, atrial flutter can be asymptomatic and thus often goes undiagnosed.
Can wearables detect a heart attack?
Last, we’re often asked, Can Apple Watch detect a heart attack? It’s a natural question, but there are a few of things to remember.
First off, a heart attack is only one of three lethal outcomes in heart disease; the other two, stroke and cardiac arrest, kill more people. Second, heart attack survival rate is currently about 95%, compared with 60% for stroke and 8% for cardiac arrest, so the potential benefit of detection is higher for the latter two. Third, if you’re having a heart attack, your heart rate may be lower, higher, or the same as average, which makes it hard to diagnose heart attacks by an optical sensor. The tests people use today are the ECG (e.g., ST segment elevation) and troponin.
Those factors together suggest heart rhythm (or other conditions correlated with heart rate variability—more on that in future posts) are the more likely targets for current wearable technology. Of course, future Apple Watches (and Fitbits, Xiaomis, Android Wear devices, …) may include an ECG sensor, in which case even more possibilities will emerge.
Have an Apple Watch? You can help.
It’s early days for wearables in healthcare, but there is a lot of potential. For example, recent research suggests that if you can monitor people with a cryptogenic stroke for three weeks rather than the standard 48 hours, you can detect 5x as much atrial fibrillation [3].
What would happen if we could extend that monitoring interval to a year? Your whole life?
If you have an Apple Watch—regardless of whether you have a heart condition—you can help us find out. We’re running the mRhythm Study with the UCSF Health eHeart Study, using Cardiogram to train a deep learning algorithm to detect atrial fibrillation. You can contribute regardless of whether you have a heart condition.
If you have an Apple Watch, please do sign up at mRhythmStudy.org.
Notes
[1] In more detail: every normal heart beat has four phases, starting with an electrical impulse generated by the SA node (pacemaker cells), which causes an atrial contraction (P wave), passes through the AV node (PR interval), and finally causes a ventricular contraction (QRS complex). The ventricals then repolarize (T wave).
[2] More specifically, AVNRT, or AV-Nodal Reentrant Tachycardia, in which a harmful loop develops in the heart’s electrical circuit. Think of it as recursion without a base case.
[3] 3.8% at 48 hours, 9% at 7 days, 14.1% at 14 days, and 19.5% at 21 days. Outpatient cardiac telemetry detects a high rate of atrial fibrillation in cryptogenic stroke.